Tuesday, September 5, 2017

Spring Boot: Spring Boot Admin


Objective:
The objective of this tutorial is to provide overview about the Spring Boot Admin with a simple example.
Overview:
Spring Boot Admin:
Spring Boot Admin is a simple application to manage and monitor your Spring Boot Applications. The applications register with our Spring Boot Admin Client (via http) or are discovered using Spring Cloud (e.g. Eureka). The UI is just an Angular.js application on top of the Spring Boot Actuator endpoints. In case you want to use the more advanced features (e.g. jmx-, loglevel-management), Jolokia must be included in the client application.

Background:
Spring Actuators provide various endpoints as explained in one of my article. The end points provides a lot of insights about Spring Boot application. But if you have many applications running then monitoring each application by hitting the end points and inspecting the JSON response is tedious process. To avoid this hassle Code Centric team came up with Spring Boot Admin module which will provide us Admin UI Dash board to administer Spring Boot applications. This module crunches the data from Actuator end points and provides insights about all the registered applications in single dash-board. Now we will demonstrate the Spring Boot Admin features in the following sections.

Steps:
1. Goto Spring Initializer (http://start.spring.io/), enter the Artifact with some name (eureka-service, in my case), Dependencies as “Web”, “Eureka Discovery, “Actuator” and hit the button “Generate project”. This will download the zip file spring-boot-admin.zip.

2. Now unzip this project. Import the project as Maven project to Eclipse or any other IDE of your choice. I used Spring Tool Suite (STS) as my IDE here.

3. Now open the pom.xml and add the following two dependencies and save it.

<dependency>
<groupId>de.codecentric</groupId>
<artifactId>spring-boot-admin-server</artifactId>
<version>1.5.3</version>
</dependency>
<dependency>
<groupId>de.codecentric</groupId>
<artifactId>spring-boot-admin-server-ui</artifactId>
<version>1.5.3</version>
</dependency>

4. Now open the SpringBootAdminApplication.java (under \src\main\java) and add the annotation @EnableAdminServer and @EnableDiscoveryClient above @SpringBootApplication.

@EnableAdminServer
@EnableDiscoveryClient
@SpringBootApplication
public class SpringBootAdminApplication {

public static void main(String[] args) {
SpringApplication.run(SpringBootAdminApplication.class, args);
}
}

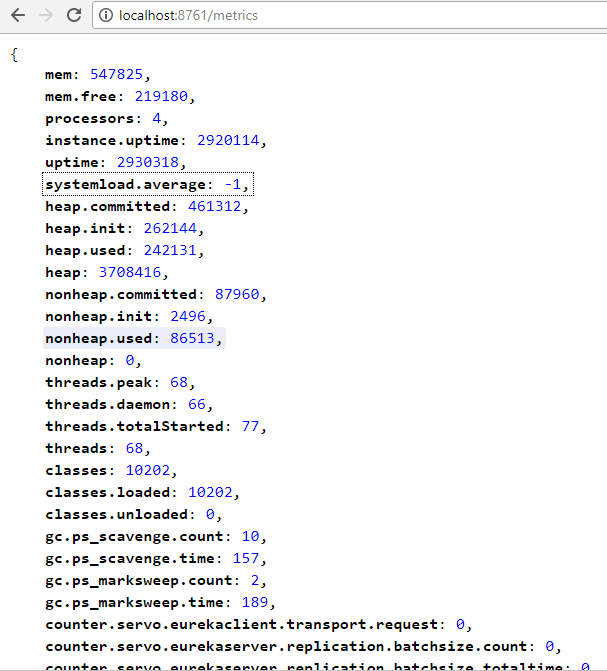
5. Add the following values to application.properties (under \src\main\resources). The points indicate that the application name is eureka-server running on port 8761. Enabling security to false will help to display values for the endpoint /metrics (which will be explained below).

spring.application.name=spring-boot-admin
server.port=8082
management.security.enabled=false

6. Now run the project as Spring Boot App (Right click on the project --> Run As --> Spring Boot App). Note: I am using Spring Tool Suite (STS) as my IDE.


7. Now open your browser and type the following URL, which will bring the Spring Boot UI as shown in the below screen shot. You can hit “Allow” button in the popup.
http://localhost:8082/

Home Page (Applications Tab):


Details Tab:


Metrics Tab:


Environment Tab:


Logging Tab:


Threads Tab:


Audit Tab:


Trace Tab:


Heapdump Tab:
It will download the Heapdump automatically.

Journal Tab:


Steps to add JMX Tab:
1. If you would like to add JMX tab to be added to Spring Boot Admin, include the following Jolokia dependency to pom.xml

<dependency>
<groupId>org.jolokia</groupId>
<artifactId>jolokia-core</artifactId>

</dependency>

2. Create a file named logback.xml under \src\main\resources and add the following entry. This will help

<?xml version="1.0" encoding="UTF-8"?>
<configuration>
              <include resource="org/springframework/boot/logging/logback/base.xml"/>
              <jmxConfigurator/>

</configuration>

3. Now you will see the JMX tab as shown below:


Login Feature:
It is possible to introduce login feature to Spring Boot Admin UI. The following additional settings are required to enable this:
1. Add the following entry in pom.xml to add Spring Security and Admin server UI login feature.
<dependency>
              <groupId>org.springframework.boot</groupId>
              <artifactId>spring-boot-starter-security</artifactId>
       </dependency>
             
       <dependency>
              <groupId>de.codecentric</groupId>
              <artifactId>spring-boot-admin-server-ui-login</artifactId>
              <version>1.5.3</version>

       </dependency>

2. Add the following additional entries highlighted in yellow in the application.properties file (under \src\main\resources). This is the user id and password.
spring.application.name=spring-boot-admin
server.port=8082
management.security.enabled=false
security.user.name=admin
security.user.password=admin123

3. Add the Spring Security logic as shown below:

@EnableAdminServer
@EnableDiscoveryClient
@SpringBootApplication
public class SpringBootAdminApplication {

       public static void main(String[] args) {
              SpringApplication.run(SpringBootAdminApplication.class, args);
       }


@Configuration
       public static class SecurityConfig extends WebSecurityConfigurerAdapter {
              @Override
              protected void configure(HttpSecurity http) throws Exception {
// Page with login form is served as /login.html and does a POST on /login
                                                                                                              http.formLogin().loginPage("/login.html")
.loginProcessingUrl("/login").permitAll();
                     // The UI does a POST on /logout on logout
                     http.logout().logoutUrl("/logout");
                     // The ui currently doesn't support csrf
                     http.csrf().disable();

                     // Requests for the login page and the static assets are allowed
                     http.authorizeRequests()
.antMatchers("/login.html", "/**/*.css", "/img/**", "/third-party/**")
                     .permitAll();
                     // ... and any other request needs to be authorized
                     http.authorizeRequests().antMatchers("/**").authenticated();

// Enable so that the clients can authenticate via HTTP basic for registering
                     http.httpBasic();
              }
       }

       // end::configuration-spring-security[]

4. Now if you start the server and hit the following URL, you will now see the login page as shown below.

5. Enter the user id as admin and password as admin123 so that you will land to the Spring Boot Admin UI home page. Also you will find the logout button the home page. On-click of that you will be logged out and will display login screen again.


That’s all. Hope this was useful.

Monday, September 4, 2017

Spring Boot: Spring Boot Actuators


Objective:
The objective of this tutorial is to provide overview about the Spring Boot Actuators with a simple example.

Overview:
Spring Boot Actuators:
Actuators enable production-ready features to a Spring Boot application – without having to actually implement these things yourself.
They’re mainly used to expose different types of information about the running application – health, metrics, info, dump, env etc. And while these are no replacement for a production-grade monitoring solution – they’re a very good starting point.
As part of micro services development many of us are using Spring Boot along with Spring Cloud features. In micro services world we will have many Spring Boot applications which will be running on same/different hosts. If we add Spring Actuator to the Spring Boot applications, we will get a lot of out of the box end points to monitor and interact with Spring Boot applications. The list is given below.

ID
Description
Sensitive Default
actuator
Provides a hypermedia-based “discovery page” for the other endpoints. Requires Spring HATEOAS to be on the classpath.
true
auditevents
Exposes audit events information for the current application.
true
autoconfig
Displays an auto-configuration report showing all auto-configuration candidates and the reason why they ‘were’ or ‘were not’ applied.
true
beans
Displays a complete list of all the Spring beans in your application.
true
configprops
Displays a collated list of all @ConfigurationProperties.
true
dump
Performs a thread dump.
true
env
Exposes properties from Spring’s ConfigurableEnvironment.
true
flyway
Shows any Flyway database migrations that have been applied.
true
health
Shows application health information (when the application is secure, a simple ‘status’ when accessed over an unauthenticated connection or full message details when authenticated).
false
info
Displays arbitrary application info.
false
loggers
Shows and modifies the configuration of loggers in the application.
true
liquibase
Shows any Liquibase database migrations that have been applied.
true
metrics
Shows ‘metrics’ information for the current application.
true
mappings
Displays a collated list of all @RequestMapping paths.
true
shutdown
Allows the application to be gracefully shutdown (not enabled by default).
true
trace
Displays trace information (by default the last 100 HTTP requests).
true


Customizing Existing End points:
Each endpoint can be customized with properties using the following format: endpoints.[endpoint name].[property to customize]
Three properties are available:
id – by which this endpoint will be accessed over HTTP
enabled – if true then it can be accessed otherwise not
sensitive – if true then need the authorization to show crucial information over HTTP
For example, add the following properties will customize the /beans endpoint:
endpoints.beans.id=springbeans
endpoints.beans.sensitive=false
endpoints.beans.enabled=true

Steps:
Eureka Server:
1. Goto Spring Initializer (http://start.spring.io/), enter the Artifact with some name (eureka-service, in my case), Dependencies as “Eureka Server” and hit the button “Generate project”. This will download the zip file eureka-service.zip.


2. Now unzip this project. Import the project as Maven project to Eclipse or any other IDE of your choice. I used Spring Tool Suite (STS) as my IDE here.
3. Now open the EurekaServiceApplication.java (under \src\main\java) and add the annotation @EnableEurekaServer above @SpringBootApplication.

@EnableEurekaServer
@SpringBootApplication
public class EurekaServiceApplication {

public static void main(String[] args) {
SpringApplication.run(EurekaServiceApplication.class, args);
}
}
4. Add the following values to application.properties (under \src\main\resources). The points indicate that the application name is eureka-server running on port 8761. Enabling security to false will help to display values for the endpoint /metrics (which will be explained below).

spring.application.name=eureka-server
server.port=8761

management.security.enabled=false


5. Now run the project as Spring Boot App (Right click on the project  Run As  Spring Boot App). Note: I am using Spring Tool Suite (STS) as my IDE.


6. Once the project is started in port 8761, you will find the Spring Eureka UI as shown in the below screen shot:
http://localhost:8761/


Client 1- Client A:
Let’s now develop Client A and Client B, which is Eureka Client.
1. Goto Spring Initializer (http://start.spring.io/), enter the Artifact with some name (client-a, in my case), Dependencies as “Web, “Actuator”, “Eureka Discovery” and hit the button “Generate project”. This will download the zip file client-a.zip.


2. Now unzip this project. Import the project as Maven project to Eclipse or any other IDE of your choice. I used Spring Tool Suite (STS) as my IDE here.

3. Now open the ClientAApplication.java (under \src\main\java) and add the annotation @EnableDiscoveryClient above @SpringBootApplication. Also let’s add another annotation @RestController and a Rest Method @GetMapping(“/”) with function name() which returns a.

package com.example.clienta;

import org.springframework.boot.SpringApplication;
import org.springframework.boot.autoconfigure.SpringBootApplication;
import org.springframework.cloud.client.discovery.EnableDiscoveryClient;
import org.springframework.web.bind.annotation.GetMapping;
import org.springframework.web.bind.annotation.RestController;

@EnableDiscoveryClient
@SpringBootApplication
@RestController
public class ClientAApplication {

@GetMapping("/")
public String name(){
return "a";
}

public static void main(String[] args) {
SpringApplication.run(ClientAApplication.class, args);
}
}

4. Add the following values to application.properties (under \src\main\resources). The points indicate that the application name is client-a running on port 8091. Enabling security to false will help to display values for the endpoint /metrics (which will be explained below).

spring.application.name=client-a
server.port=8091

management.security.enabled=false

5. Now run the project as Spring Boot App (Right click on the project  Run As  Spring Boot App). Note: I am using Spring Tool Suite (STS) as my IDE.


6. Once the project is started in port 8092, you will find the value a as shown in the below screen shot:
http://localhost:8092/

7. Now if you refresh Eureka Server URL (http://localhost:8761/) you will now see a new entry Client A, which is registered with Eureka Server.


Client 2- Client B:

1. Similarly, create another project in Spring Initializer (http://start.spring.io/) with the Artifact with some name (client-b, in my case), Dependencies as “Web, “Actuator”, “Eureka Discovery” and hit the button “Generate project”. This will download the zip file client-b.zip.


2. Now unzip this project. Import the project as Maven project to Eclipse or any other IDE of your choice. I used Spring Tool Suite (STS) as my IDE here.

3. Now open the ClientAApplication.java (under \src\main\java) and add the annotation @EnableDiscoveryClient above @SpringBootApplication. Also let’s add another annotation @RestController and a Rest Method @GetMapping(“/”) with function name() which returns b.

package com.example.clienta;

import org.springframework.boot.SpringApplication;
import org.springframework.boot.autoconfigure.SpringBootApplication;
import org.springframework.cloud.client.discovery.EnableDiscoveryClient;
import org.springframework.web.bind.annotation.GetMapping;
import org.springframework.web.bind.annotation.RestController;

@EnableDiscoveryClient
@SpringBootApplication
@RestController
public class ClientBApplication {

@GetMapping("/")
public String name(){
return "b";
}

public static void main(String[] args) {
SpringApplication.run(ClientAApplication.class, args);
}
}

4. Add the following values to application.properties (under \src\main\resources). The points indicate that the application name is client-b running on port 8092. Enabling security to false will help to display values for the endpoint /metrics (which will be explained below).

spring.application.name=client-b
server.port=8092

management.security.enabled=false

5. Now run the project as Spring Boot App (Right click on the project --> Run As -->Spring Boot App). Note: I am using Spring Tool Suite (STS) as my IDE.

6. Once the project is started in port 8092, you will find the value a as shown in the below screen shot:
http://localhost:8092/

7. Now if you refresh Eureka Server URL (http://localhost:8761/) you will now see a new entry Client B (and Client A), which is registered with Eureka Server.


Actuator Endpoints:
Now let’s view various actuator end points that Spring provides by-default. The json output can be viewed in browser, but to view the output in more readable format, you can install JSONView Chrome browser extension plugin (if you don’t have it already). You can install the plugin from the following URL:
https://chrome.google.com/webstore/detail/jsonview/chklaanhfefbnpoihckbnefhakgolnmc?hl=en
Click the above link and hit the button “ADD TO CHROME” button, which will install the plugin. (The screen shows as “ADDED TO CHROME” because it is already installed in my browser).


Now let’s look at various Endpoints. Whatever I am listing is just a sub-set of the Endpoints only.
1) /health Endpoint:
This /health endpoint displays application health information (when the application is secure, a simple ‘status’ when accessed over an unauthenticated connection or full message details when authenticated).
http://localhost:8761/health


2) /autoconfig Endpoint:
Displays an auto-configuration report showing all auto-configuration candidates and the reason why they ‘were’ or ‘were not’ applied.
http://localhost:8761/autoconfig


3) /beans Endpoint:
Displays a complete list of all the Spring beans in your application.
http://localhost:8761/beans


4) /configprops Endpoint:
Displays a collated list of all @ConfigurationProperties.
http://localhost:8761/configprops/


5) /dump Endpoint:
Displays the thread dump details.
http://localhost:8761/dump/


6) /env Endpoint:
Exposes properties from Spring’s ConfigurableEnvironment.
http://localhost:8761/env/


7) /info Endpoint:
Displays arbitrary application info.
http://localhost:8761/info/


8) /loggers Endpoint:
Shows and modifies the configuration of loggers in the application.
http://localhost:8761/loggers/


9) /metrics Endpoint:
Displays arbitrary application info.
http://localhost:8761/metrics/


10) /mappings Endpoint:
Displays a collated list of all @RequestMapping paths.
http://localhost:8761/mappings/


11) /trace Endpoint:
Displays trace information (by default the last 100 HTTP requests).
http://localhost:8761/trace/


That’s all. Hope this was useful.

Next:
The next tutorial will be on Spring Boot Admin UI.